

Predictive value of the first blood routine parameters within 24 hours of admission for critical illness in children
-
摘要:
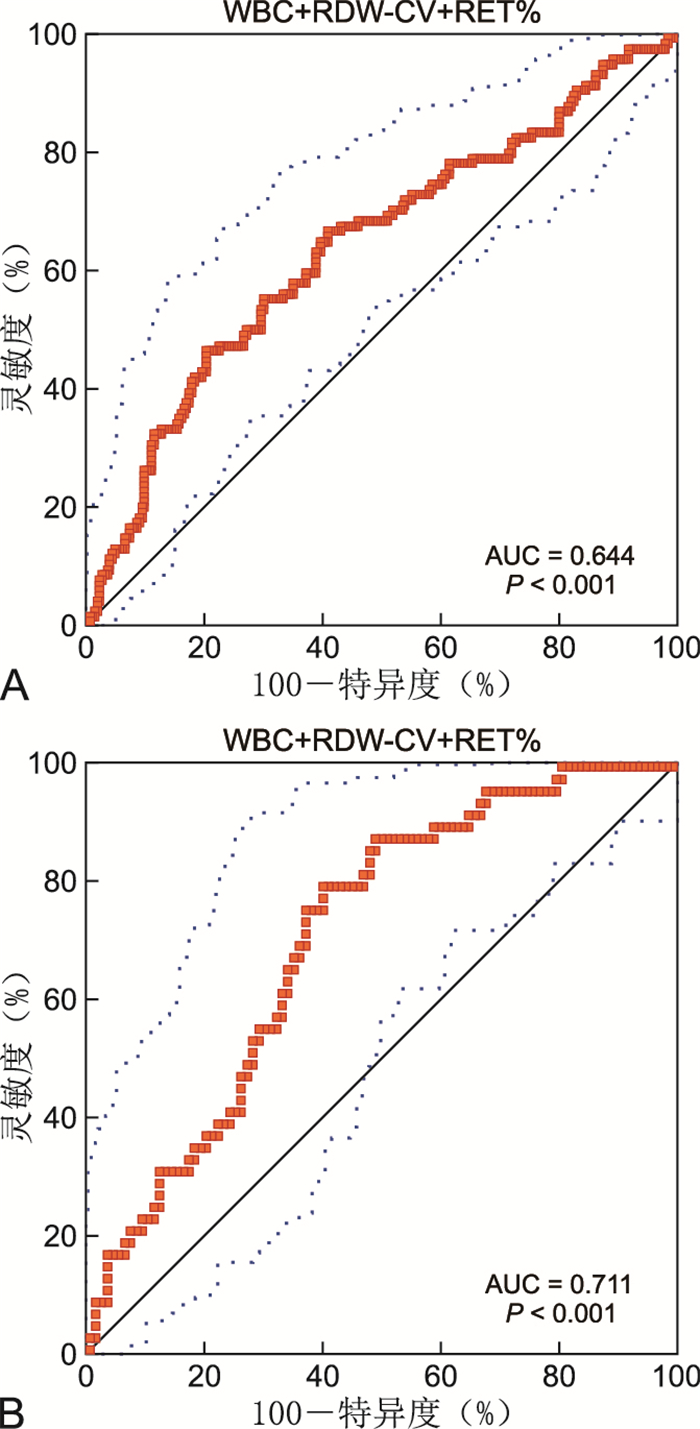
目的 探讨入院24 h内首次血常规参数与儿童危重症的相关性,并建立ROC曲线和列线图模型以评价其对儿童危重症的预测价值。 方法 以2015年4月—2019年12月蚌埠医学院第一附属医院儿童重症监护室入院24 h内行血常规检查并完成小儿危重病例评分的患儿为研究对象。将患儿随机分为训练队列和验证队列,训练队列患儿变量与危重症的相关性采用logistic回归分析。采用受试者工作特征曲线分析变量对2个队列危重症的预测效能,采用R语言构建训练队列列线图预测模型评估危重症的发生概率。 结果 共纳入496例患儿,男283例,女213例,中位年龄2.0(0.57,5.88)岁。训练队列347例,验证队列149例。白细胞计数(WBC)、红细胞分布宽度CV(RDW-CV)及网织红细胞百分比(RET%)与训练队列患儿危重症显著相关(均P < 0.05),WBC+RDW-CV+RET%联合指标预测训练队列及验证队列危重症的曲线下面积分别为0.644和0.711,在最佳截断值为0.357和0.290时,联合指标预测2个队列危重症的灵敏度分别为46.4%和79.6%,特异度分别为80.0%和60.0%。以训练队列WBC、RDW-CV及RET%构建列线图模型,一致性指数、校准曲线、决策曲线和临床影响曲线分析表明列线图可预测儿童危重症。 结论 入院24 h内首次WBC+RDW-CV+RET%对儿童危重症具有较好的预测效能,以WBC、RDW-CV及RET%构建的列线图可预测儿童危重症的发生概率。 Abstract:Objective To explore the correlation between the first blood routine parameters within 24 hours of admission and critical illness in children, and establish ROC curve and a nomogram model to evaluate their predictive value for critical illness in children. Methods Patients who underwent blood routine test and completed pediatric critical illness score within 24 hours of admission in the Pediatric Intensive Care Unit of the First Affiliated Hospital of Bengbu Medical College from April 2015 to December 2019 were enrolled. The patients were randomly divided into a training cohort and a validation cohort. The correlation between the variables of the training cohort and critical illness was analyzed by logistic regression analysis. The predictive performances of variables for critical illness in the two cohorts were analyzed by receiver operating characteristic curve. The nomogram prediction model of the training cohort was constructed using R language to assess the occurrence probability of critical illness. Results Among 496 patients, there were 283 males and 213 females, with a median age of 2.0 (0.57, 5.88) years. There were 347 patients in the training cohort, and 149 patients in the validation cohort. White cell count (WBC), red cell distribution width-coefficient of variation (RDW-CV), and reticulocyte percentage (RET%) were significantly associated with critical illness in children in the training cohort (all P < 0.05). The receiver operating characteristic curve analysis showed that the areas under the curve of WBC+RDW-CV+RET% combined index for predicting critical illness in the training cohort and the validation cohort were 0.644 and 0.711, respectively. When the optimal cut-off values of 0.357 for the training cohort and 0.290 for the validation cohort were used, sensitivities of the combined index for predicting critical illness were 46.4% and 79.6%, and specificities were 80.0% and 60.0%, respectively. The nomogram prediction model was constructed using WBC, RDW-CV, and RET% of the patients in the training cohort. The concordance index, calibration curve, decision curve, and clinical impact curve analyses indicated that this nomogram could be used to predict critical illness in children. Conclusion The first WBC+RDW-CV+RET% combined index within 24 hours of admission has a good predictive performance for critical illness in children. The nomogram constructed by WBC, RDW-CV, and RET% can be used to predict the occurrence probability of critical illness in children. -
Key words:
- Critical illness /
- Blood cell count /
- ROC Curves /
- Nomogram /
- Children
-

图 1 WBC+RDW-CV+RET%联合指标预测训练队列和验证队列危重症的ROC曲线
注:A为训练队列受试者工作特征曲线,B为验证队列受试者工作特征曲线。
Figure 1. Combined WBC+RDW-CV+RET% to predict ROC curve of critical illness in training cohort and validation cohort

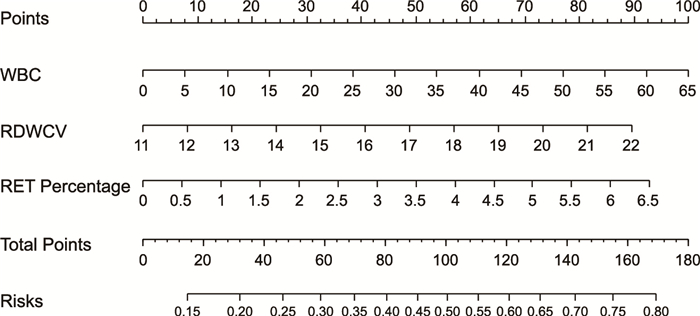
图 2 列线图预测儿童危重症
注:个体患儿危重症风险概率估计如下,在WBC、RDW-CV、RET%变量轴上确定相应的值,从该值到顶部的Points轴绘制一条垂直线,以确定变量对应的分值,然后将3个变量的分值相加,在Total Points轴找到对应的总分并垂直投影到底部的Risks轴,获得个体患儿危重症发生的风险概率。
Figure 2. Nomogram for predicting critical illness in children

图 3 列线图预测训练队列和验证队列危重症发生的校准曲线、决策曲线及临床影响曲线分析
注:A为训练队列校准曲线,B为验证队列校准曲线。长虚线为45°对角线,代表最佳预测结果,短虚线为危重症发生曲线,实线为危重症预测曲线。C为训练队列决策曲线,D为验证队列决策曲线。横坐标为风险阈概率,纵坐标为净获益,无治疗线(蓝色实线)表示所有患儿被认为是非危重症不治疗的净获益,治疗线(绿色实线)表示所有患儿被认为是危重症接受治疗的净获益,红色实线分别为2个队列的模型曲线。E为训练队列临床影响曲线,F为验证队列临床影响曲线。横坐标为风险阈概率,纵坐标为危重症高危人数,红色曲线表示在各个风险阈概率下,被模型判定为危重症高风险的预测曲线,蓝色虚线为各个风险阈概率下危重症的发生曲线。
Figure 3. Analysis of calibration curve, decision curve and clinical influence curve of critical illness occurrence in training cohort and validation cohort
表 1 训练队列和验证队列基线特征比较
Table 1. Comparison of baseline characteristics between training queue and validation queue
项目 训练队列(n=347) 验证队列(n=149) 统计量 P值 危重症[例(%)] 112(32.3) 49(32.9) 0.018a 0.894 年龄[(岁)] 5.70(3.20,11.40) 1.83(0.62,6.00) -0.671b 0.502 性别[例(%)] 男 201(57.9) 82(55.0) 0.356a 0.551 女 146(42.1) 67(45.0) WBC(×109/L) 12.06(8.35,17.63) 12.04(8.36,19.15) -0.719b 0.472 N(%) 67.20(48.90,81.80) 69.40(52.90,80.15) -0.088b 0.930 RBC(×1012/L) 4.26(3.78,4.59) 4.20(3.77,4.53) -0.946b 0.344 HB(g/L) 115(103,125) 115(101.5,124.0) -0.436b 0.663 HCT 0.35(0.31,0.37) 0.34(0.31,0.37) -0.982b 0.326 PLT(×109/L) 310(234,310) 305(233,391) -0.225b 0.822 MCV(fL) 81.6(78.0,85.7) 81.6(77.65,85.25) -0.309b 0.758 MCH(pg) 27.4(26.1,28.8) 27.6(26.05,28.7) -0.381b 0.703 MCHC(g/L) 334(325,345) 337(327,345) -1.030b 0.303 RDW-CV(%) 13.6(12.9,14.6) 13.6(13.0,14.7) -0.042b 0.967 RDW-SD(fL) 40.3(37.9,43.3) 40.5(38.25,43.55) -0.338b 0.735 MPV(fL) 7.2(6.7,8.8) 7.5(6.8,9.4) -1.992b 0.065 PCT(ml/L) 0.30(0.23,0.39) 0.30(0.23,0.39) -0.116b 0.908 PDW(%) 11.1(10.1,12.2) 11.0(10.1,12.3) -0.187b 0.852 P-LCR(%) 23.7(19.2,28.8) 23.2(19.15,29.25) -0.170b 0.865 RET% 0.88(0.65,1.27) 0.89(0.64,1.38) -0.185b 0.854 IRF(%) 5.7(3.2,11.4) 5.3(2.7,11.3) -0.671b 0.502 注:a为χ2值,b为Z值。  下载: 导出CSV
表 2 训练队列危重症危险因素单因素logistic回归分析
Table 2. Univariate logistic regression analysis of critical illness risk factors in training cohort
变量 β SE Waldχ2 P值 OR值 95% CI 年龄(岁) -0.191 0.156 1.504 0.220 0.826 0.777~0.905 性别 -0.061 0.233 0.068 0.794 0.941 0.596~1.486 WBC(×109/L) 0.032 0.014 5.308 0.021 1.033 1.005~1.061 N(%) -0.009 0.005 2.922 0.087 0.991 0.980~1.001 RBC(×1012/L) -0.364 0.173 4.438 0.035 0.695 0.496~0.975 HB(g/L) -0.014 0.006 4.880 0.027 0.986 0.973~0.998 HCT -3.997 2.287 3.055 0.080 0.018 0.000~1.624 PLT(×109/L) 0.001 0.001 0.792 0.374 1.001 0.999~1.002 MCV(fL) 0.018 0.017 1.079 0.299 1.018 0.984~1.054 MCH(pg) -0.010 0.042 0.060 0.806 0.990 0.911~1.075 MCHC(g/L) -0.013 0.007 3.506 0.061 0.987 0.974~1.001 RDW-CV(%) 0.226 0.076 8.878 0.003 1.254 1.080~1.455 RDW-SD(fL) 0.061 0.020 9.132 0.003 1.063 1.022~1.106 MPV(fL) 0.071 0.079 0.812 0.368 1.074 0.919~1.255 PCT(ml/L) 0.988 0.854 1.336 0.248 2.685 0.503~14.332 PDW(%) 0.011 0.055 0.041 0.839 1.011 0.907~1.127 P-LCR(%) 0.005 0.014 0.141 0.707 1.005 0.978~1.034 RET% 0.367 0.125 8.579 0.003 1.444 1.129~1.846 IRF 0.041 0.015 7.394 0.007 1.042 1.011~1.073
下载: 导出CSV
表 3 训练队列危重症危险因素多因素logistic回归分析
Table 3. Multivariate logistic regression analysis of critical illness risk factors in training cohort
变量 β SE Waldχ2 P值 OR值 95% CI WBC(×109/L) 0.031 0.014 4.809 0.028 1.032 1.003~1.061 RDW-CV(%) 0.164 0.080 4.181 0.041 1.179 1.007~1.380 RET% 0.288 0.132 4.782 0.029 1.334 1.030~1.728
下载: 导出CSV
-
[1] 中华医学会儿科学会急救学组. 第四届全国小儿急救医学研讨会纪要[J]. 中华儿科杂志, 1995, 33(6): 370-373. https://www.cnki.com.cn/Article/CJFDTOTAL-ZHEK506.024.htmFirst aid Group of Pediatrics Society of Chinese Medical Association. Summary of the Fourth National Pediatric Emergency Medicine Seminar[J]. Chinese Journal of Pediatrics, 1995, 33(6): 370-373. https://www.cnki.com.cn/Article/CJFDTOTAL-ZHEK506.024.htm [2] 小儿危重病例评分试用协作组. 小儿危重病例评分法(草案)临床应用的评价[J]. 中华儿科杂志, 1998, 36(10): 579-582. doi: 10.3760/j.issn:0578-1310.1998.10.001Pediatric critical case scoring trial collaboration group. Evaluation of pediatric critical illness scoring system in clinical application[J]. Chinese Journal of Pediatrics, 1998, 36(10): 579-582. doi: 10.3760/j.issn:0578-1310.1998.10.001 [3] 简化小儿危重病例评分试用协作组. 简化小儿危重病例评分法的临床应用[J]. 中华儿科杂志, 2003, 41(8): 565-569. doi: 10.3760/j.issn:0578-1310.2003.08.003Simplified pediatric critical case scoring trial collaboration group. Clinical application of simplified pediatric critical illness scoring system[J]. Chinese Journal of Pediatrics, 2003, 41(8): 565-569. doi: 10.3760/j.issn:0578-1310.2003.08.003 [4] BALOCH S H, IBRAHIM P M N, LOHANO P D, et al. Pediatric risk of mortality Ⅲ Score in predicting mortality among diabetic ketoacidosis patients in a pediatric intensive care unit[J]. Cureus, 2021, 13(11): e19734. DOI: 10.7759/cureus.19734. [5] ZHENG Y, ZHANG Y, CHI H, et al. The hemocyte counts as a potential biomarker for predicting disease progression in COVID-19: a retrospective study[J]. Clin Chem Lab Med, 2020, 58(7): 1106-1115. doi: 10.1515/cclm-2020-0377 [6] PURCELL L N, PRIN M, SINCAVAGE J, et al. Outcomes following intensive care unit admission in a pediatric cohort in Malawi[J]. Trop Pediatr, 2020, 66(6): 621-629. doi: 10.1093/tropej/fmaa025 [7] KARAGOZ I, AKTAS G, YOLDAS H, et al. Association between hemogram parameters and survival of critically ill patients[J]. Intensive Care Med, 2019, 34(6): 511-513. doi: 10.1177/0885066617703348 [8] ZHANG Z, LIN E, ZHUANG H, et al. Construction of a novel gene-based model for prognosis prediction of clear cell renal cell carcinoma[J]. Cancer Cell Int, 2020, 20: 27. doi: 10.1186/s12935-020-1113-6 [9] WANG K, LI M, LIU R, et al. Analysis of risk factors for anastomotic leakage after laparoscopic anterior resection of rectal cancer and construction of a nomogram prediction model[J]. Cancer Manag Res, 2022, 14: 2243-2252. doi: 10.2147/CMAR.S364875 [10] PARK S Y. Nomogram: an analogue tool to deliver digital knowledge[J]. J Thorac Cardiovasc Surg, 2018, 155(4): 1793. doi: 10.1016/j.jtcvs.2017.12.107 [11] XIAO R, QIN Y, LIU L, et al. Development and validation of nomogram based on a novel platelet index score to predict prognosis in patients with renal cell carcinoma[J]. J Cancer, 2021, 12(21): 6301-6309. doi: 10.7150/jca.60268 [12] WU J, ZHANG H, LI L, et al. A nomogram for predicting overall survival in patients with low-grade endometrial stromal sarcoma: a population-based analysis[J]. Cancer Commun (Lond), 2020, 40(7): 301-312. doi: 10.1002/cac2.12067 [13] VICKERS A J, VAN CALSTER B, STEYERBERG E W. A simple, step-by-step guide to interpreting decision curve analysis[J]. Diagn Progn Res, 2019, 3: 18. doi: 10.1186/s41512-019-0064-7 [14] WANG K, GONG M, XIE S, et al. Nomogram prediction for the 3-year risk of type 2 diabetes in healthy mainland China residents[J]. EPMA, 2019, 10(3): 227-237. doi: 10.1007/s13167-019-00181-2 [15] DENG X, HOU H, WANG X, et al. Development and validation of a nomogram to better predict hypertension based on a 10-year retrospective cohort study in China[J]. Elife, 2021, 10: e66419. DOI: 10.7554/eLife.66419. [16] SHAH S, DESHMUKH C T, TULLU M S. The predictors of outcome and progression of pediatric sepsis and septic shock: a prospective observational study from western India[J]. Postgrad Med, 2020, 66(2): 67-72. doi: 10.4103/jpgm.JPGM_171_19 [17] CORONADO M A, TASAYCO J, MORALES W, et al. High incidence of stroke and mortality in pediatric critical care patients with COVID-19 in Peru[J]. Pediatr Res, 2022, 91(7): 1730-1734. doi: 10.1038/s41390-021-01547-x [18] SILVA LITAO M K, KAMAT D. Back to basics: red blood cell distribution width: clinical use beyond hematology[J]. Pediatr Rev, 2018, 39(4): 204-209. doi: 10.1542/pir.2017-0118 [19] KIM D H, HA E J, PARK S J, et al. Evaluation of the usefulness of red blood cell distribution width in critically ill pediatric patients[J]. Medicine (Baltimore), 2020, 99(36): e22075. DOI: 10.1097/MD.0000000000022075. [20] LEE J, ZHU Y, WILLIAMS D J, et al. Red blood cell distribution width and pediatric community-acquired pneumonia disease severity[J]. Hosp Pediatr, 2022, 12(9): 798-805. doi: 10.1542/hpeds.2022-006539 [21] 杨剑秋, 毕建洲. 红细胞分布宽度对肺部感染所致脓毒症预后的评估价值分析[J]. 中华全科医学, 2020, 18(11): 1827-1829, 1915. doi: 10.16766/j.cnki.issn.1674-4152.001629YANG J Q, BI J Z. Role of Red blood cell distribution width in evaluating the prognosis of patients with sepsis caused by pulmonary infection[J]. Chinese Journal of General Practice, 2020, 18(11): 1827-1829, 1915. doi: 10.16766/j.cnki.issn.1674-4152.001629 [22] PIERRE R V. Reticulocytes. Their usefulness and measurement in peripheral blood[J]. Clin Lab Med, 2002, 22(1): 63-79. doi: 10.1016/S0272-2712(03)00067-2 -


 点击查看大图
计量
- 文章访问数: 778
- HTML全文浏览量: 514
- PDF下载量: 15
- 被引次数: 0
